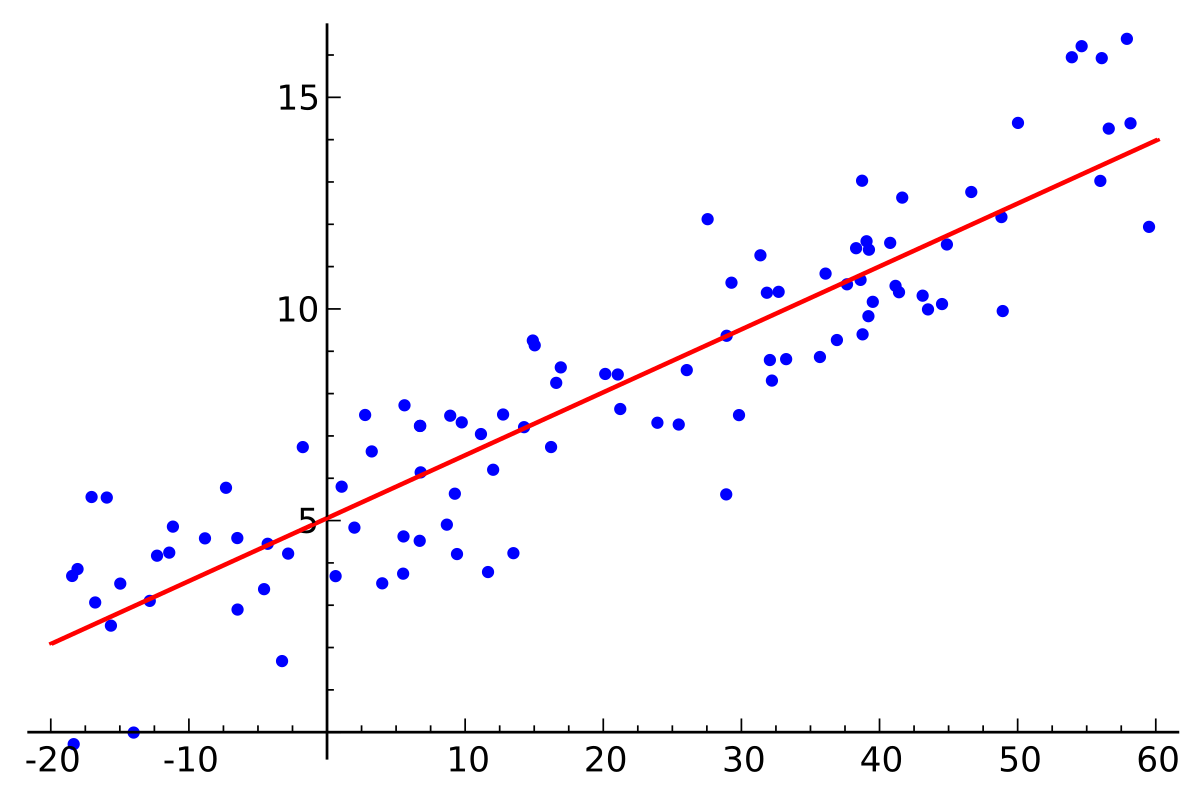
What is a linear regression?
linear regression gives the relationship between the variables i.e dependent variable and independent variable. The dependent variable is continuous and the independent variable may be continuous or discrete
linear regression is classified into two types:
*simple linear regression
*multiple linear regression or multiple regression
It is represented by an equation Y=a + b*X, where a is intercept, b is slope of the line and.This equation can be used to predict the value of target variable based on given predictor variable(s).
Gradient Descent overview.
Gradient Descent is used while training a machine learning model. It is an optimization algorithm, based on a convex function, that tweaks it’s parameters iteratively to minimize a given function to its local minimum.It is simply used to find the values of a functions parameters (coefficients) that minimize a cost function as far as possible.
A gradient measures how much the output of a function changes if you change the inputs a little bit.gradient descent is a minimization algorithm
If you are dealing with a machine learning problem and want to train your algorithm with gradient descent to minimize your cost-function J(w, b) and reach its local minimum by tweaking its parameters (w and b).
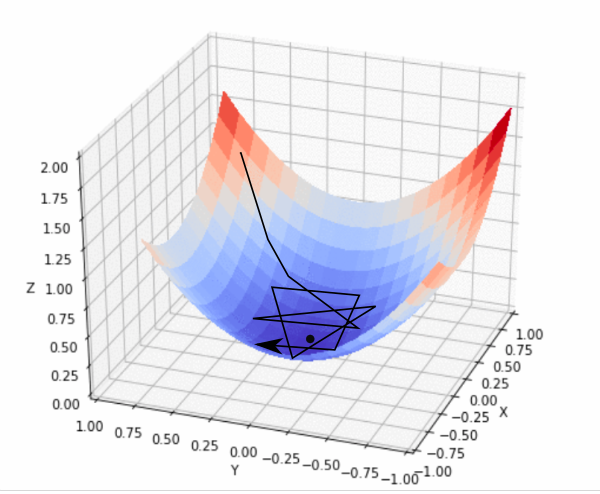
Let’s take a look at the picture below, which is an illustration of Gradient Descent. The horizontal axes represent the parameters (w and b) and the cost function J(w, b) is represented on the vertical axes. You can also see in the image that gradient descent is a convex function
Gradient Descent Calculations
The equation below describes what Gradient Descent does: “b“ describes the next position of our climber, while “a“ represents his current position. The minus sign refers to the minimization part of gradient descent. The “dollar“ in the middle is a waiting factor and the gradient term ( &f(a) ) is simply the direction of the steepest descent.
b=a-$(&f(a))
we want to find the values of W and B that correspond to the minimum of the cost function marked with the red arrow. To start with finding the right values we initialize the values of W and B with some random numbers and Gradient Descent then starts at that point somewhere around the top of our illustration. Then it takes one step after another in the steepest downside direction i.e. from the top to the bottom of the illustration, till it reaches the point where the cost function is as small as possible.
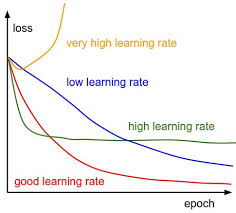
In order for Gradient Descent to reach the local minimum, we have to set the learning rate to an appropriate value, which is neither too low nor too high.
A good way to make sure that Gradient Descent runs properly is by plotting the cost function as Gradient Descent runs. You put the number of iterations on the x-axes and the value of the cost-function at the y-axes. This enables you to see the value of your cost function after each iteration of gradient descent. This lets you easily spot how appropriate your learning rate is. You just try different values for it and plot them all together.
If gradient descent is working properly, the cost function should decrease after every iteration
R and Python Overview:
R and Python are both open-source programming languages with a large community. New libraries or tools are added continuously to their repository. R is mainly used for statistical analysis while Python provides a more general approach to data science.
Python is used because it is Simple and easy to understand and learn
packages like pandas, numpy and scikit-learn, make Python an excellent choice for machine learning activities.
R is statistical tool that Consists of packages for almost any statistical application one can think of. CRAN currently hosts more than 10k packages.
CRAN is a network of ftp and web servers around the world that store identical, up-to-date, versions of code and documentation for R
It is impossible to choose out from these two as they can be used on the user needs and some programmers use both R and python in their analysis
Both R and Python are quite robust languages and either one of them is actually sufficient to carry out the Data Analysis task. However, there are definitely some high and low points for both of them and if we could utilize the strengths of both, we could end up doing a much better job. Either way, having knowledge of both will make us more flexible thereby increasing our chances of being able to work in multiple environments.