1)What is statistics?
Statistics is the branch of mathematics with developing and studying data collection, analysis, organization, interpretation, and presentation. Statistics are the numerical value used to summarize and compare a set of data.
2)Sample vs Population
A population dataset consists of all members of a specified group. For example, a list of all players played in IPL 2019.
A sample dataset consists of part or subset of the population. The size of the sample is always less than the size of the population from which it is taken. For example, a list of some players played in IPL 2019.
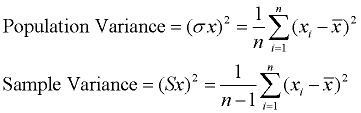
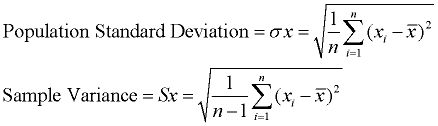
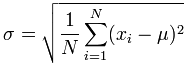
When you are dealing with the formulas of Mean Absolute Deviation, variance and standard deviation it’s important to know which type of dataset you are working with. (entire population or sample data).
Mean Absolute Deviation

Variance
Standard Deviation
3)Measure of central tendency and dispersion
A measure of central tendency is a number used to represent the center or middle of a set of data values. mean, median, mode are the commonly used measure of central tendency.
The mean of n numbers is the sum of numbers divided by n. It is denoted as X-bar.
The median of n number is the middle number of n after ordering in either ascending or descending. If n is even, then the median is the mean of two middle numbers.
The mode of n number is the number that occurs most frequently. There may be one mode, more than one mode or no mode.
Measures of dispersion
A measure of dispersion is a statistic that describes how the data are dispersed or spread out. Range and standard deviation are the two measures of dispersion.
A range that gives you the difference between the greatest and smallest of the data values.
Example: consider a dataset 15,24,2,5,8,20,12,22 find out the range for the given dataset.
24-2=22 is the range
Standard Deviation describes the typical difference between a data value and means.
Outliers is a value that is much greater than most of the other values in the data set. This can give misleading impressions to the dataset.For example, consider a dataset 9,12,8,11,15,98,17,20,14.Here, 98 is an outlier.
4)Frequency Distribution
Frequency tells you how often each value occurs. A frequency distribution is a representation, either in a graphical or tabular format, that displays the number of observations within a given interval. The intervals must be mutually exclusive and exhaustive.
Example: Consider a dataset 1,2,3,4,4,6,2,3,7,9,4,7,9
| Values | Frequency |
| 1 | 1 |
| 2 | 2 |
| 3 | 2 |
| 4 | 3 |
| 6 | 1 |
| 7 | 2 |
| 9 | 2 |
5)Cumulative Frequency Distribution
A cumulative frequency distribution is the sum of class and all classes below it in a frequency distribution. Cumulative frequency is also called running total of the frequencies.
Example: Consider a dataset 1,2,3,4,4,6,2,3,7,9,4,7,9
| Values | Frequency | Cummulative frequency |
| 1 | 1 | 1 |
| 2 | 2 | 3 |
| 3 | 2 | 5 |
| 4 | 3 | 8 |
| 6 | 1 | 9 |
| 7 | 2 | 11 |
| 9 | 2 | 13 |
Cumulative frequency is used to find out whether all the values in the data are entered or not, by adding up all the numbers and comparing it to your sample size.
6)Quartiles
Quartiles can be divided into three types. lower, middle and upper. The first quartile is defined as the difference between the smallest and the median of the dataset. The second quartile is the median of the data set. The third quartile is the middle value between the median and the highest value of the data set.
For example: consider a dataset 4,2,4,6,,7,8,5
Ascending order 2,4,4,5,6,7,8
4 is the lower quartile
5 is median ie middle quartile
7 is upper quartile
7)Interquartile range
The difference between the upper quartile and lower quartile is called the interquartile range.
Interquartile range = Q3-Q1
For example: consider a dataset 4,2,4,6,,7,8,5
Ascending order 2,4,4,5,6,7,8
Q3-Q1=7-4=3
Interquartile range = 3
8)Percentile
A percentile (or a centile) is a measure in statistics. It shows the value below which a given percentage of observations falls.
For example: consider a dataset 1,2,4,6,,7,8,5,3,9
Ascending order 1,2,3,4,5,6,7,8,9
2.5 is the lower quartile – 25th percentile
5 is median ie middle quartile – 50th percentile
7.5 is the upper quartile – 75th percentile
To find 90th percentile
(90/100)*9 = 8.1
8 is the 90th percentile.
9)Correlation
Co = ’together’ and relation = ‘connection’.Correlation is used to find the linear relationship between two continuous variables. It measures the strength and direction of the linear relationship between two or more variables.
Correlation can be positive, negative or no correlation. A positive correlation means that if one variable increases other increases as well. A negative correlation means that if one variable increases other decreases.
No correlation denotes that there is no relationship between two sets of data.
10)Correlation coefficient
A correlation coefficient is a statistical measure of the degree to which changes to the value of one variable predict change to the value of another. In positively correlated variables, the value increases or decreases in tandem. In negatively correlated variables, the value of one increases as the value of the other decreases.
The correlation coefficient always lies between -1 and +1.
A coefficient of +1 indicates a perfect positive correlation: A change in the value of one variable will predict a change in the same direction in the second variable.
A coefficient of -1 indicates a perfect negative: A change in the value of one variable predicts a change in the opposite direction in the second variable. Lesser degrees of correlation is expressed as non-zero decimals. A coefficient of zero indicates there is no discernable relationship between fluctuations of the variables.
11)Variance:
A variance is defined as the average of Squared differences from a mean value.

12)Covariance
Covariance is a measure of how much random variables vary together. It is similar to variance.variance describes how single variable vary and covariance describes how two variable varies together.
Covariance formula
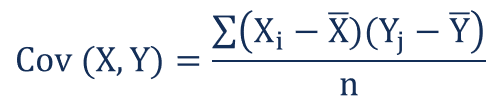
Xi = x item set
Yj = y item set
X-bar = mean of X
Y-bar = mean of Y
n = Number of items
13)Coefficient of variation:
The coefficient of variation is equal to the standard deviation divided by mean. It is a useful statistic for comparing the degree of variation from one data series to another, even if the means are drastically different from one another.
Formula:
CV= (σ/X)×100
-
- CV = Coefficient of Variation.
- σ = standard deviation.
-
- X = mean.